Pseudo-Phantoms
Published 16 years, 7 months pastIn the course of a recent debugging session, I discovered a limitation of web inspectors (Firebug, Dragonfly, Safari’s Web Inspector, et al.) that I hadn’t quite grasped before: they don’t show pseudo-elements and they’re not so great with pseudo-classes. There’s one semi-exception to this rule, which is Internet Explorer 8’s built-in Developer Tool. It shows pseudo-elements just fine.
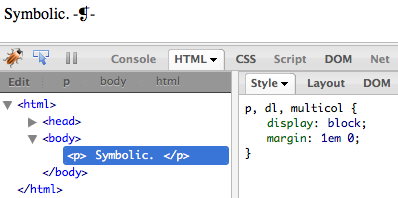
Here’s an example of what I’m talking about:
p::after {content: " -\2761-"; font-size: smaller;}
Drop that style into any document that has paragraphs. Load it up in your favorite development browser. Now inspect a paragraph. You will not see the generated content in the DOM view, and you won’t see the pseudo-element rule in the Styles tab (except in IE, where you get the latter, though not the former).
The problem isn’t that I used an escaped Unicode reference; take that out and you’ll still see the same results, as on the test page I threw together. It isn’t the double-colon syntax, either, which all modern browsers handle just fine; and anyway, I can take it back to a single colon and still see the same results. ::first-letter, ::first-line, ::before, and ::after are all basically invisible in most inspectors.
This can be a problem when developing, especially in cases such as having a forgotten, runaway generated-content clearfix making hash of the layout. No matter how many times you inspect the elements that are behaving strangely, you aren’t going to see anything in the inspector that tells you why the weirdness is happening.
The same is largely true for dynamic pseudo-classes. If you style all five link states, only two will show up in most inspectors—either :link or :visited, depending on whether you’ve visited the link’s target; and :focus. (You can sometimes also get :hover in Dragonfly, though I’ve not been able to do so reliably. IE8’s Developer Tool always shows a:link even when the link is visited, and doesn’t appear to show any other link states. …yes, this is getting complicated.)
The more static pseudo-classes, like :first-child, do show up pretty well across the board (except in IE, which doesn’t support all the advanced static pseudo-classes; e.g., :last-child).
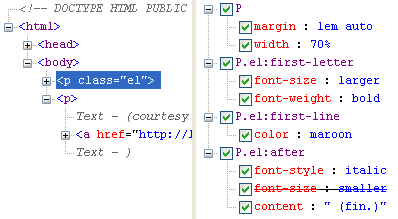
I can appreciate that inspectors face an interesting challenge here. Pseudo-elements are just that, and aren’t part of the actual structure. And yet Internet Explorer’s Developer Tool manages to find those rules and display them without any fuss, even if it doesn’t show generated content in its DOM view. Some inspectors do better than others with dynamic pseudo-classes, but the fact remains that you basically can’t see some of them even though they will potentially apply to the inspected link at some point.
I’d be very interested to know what inspector teams encountered in trying to solve this problem, or if they’ve never tried. I’d be especially interested to know why IE shows pseudo-elements when the others don’t—is it made simple by their rendering engine’s internals, or did someone on the Developer Tool team go to the extra effort of special-casing those rules?
For me, however, the overriding question is this: what will it take for the various inspectors to behave more like IE’s does, and show pseudo-element and pseudo-class rules that are associated with the element currently being inspected? And as a bonus, to get them to show in the DOM view where the pseudo-elements actually live, so to speak?
(Addendum: when I talk about IE and the Developer Tool in this post, I mean the tool built into IE8. I did not test the Developer Toolbar that was available for IE6 and IE7. Thanks to Jeff L for pointing out the need to be clear about that.)
Comments (19)
Funny, I’ve needed to debug problems with pseudo-rules before simply knew they wouldn’t show up in firebug, etc, and never gave it a second thought that they weren’t there. Whereas you realized right away and called them out.
If this ends up getting support added to firebug and others, I tip my cap to you for seeing the forest for the trees.
Thanks for using your status to bring some attention to the issue. I’ll be interested to hear from the various developers behind the tools as well.
Just to clarify though, you are only seeing the proper behavior in IE8’s built in “Developer Tool” not the “Developer Toolbar” that was available for IE6 and IE7, correct?
Jeff L: correct, I mean IE8’s tool. I didn’t test out the toolbar for IE6 and IE7. I’ll edit the post to clarify that. Thanks!
The missing pseudo elements are not the fault of Firebug as far as I know, but rather Gecko’s own DOM reporting, for that is what Firebug is tapping into to report back to you. Sounds like a fine issue/improvement to file over at Bugzilla.
For what it’s worth, I can get firebug to also show me the :hover pseudo class if I first click “inspect” in the Firebug toolbar and then hover over and click the element on which I’m trying to see the CSS cascade and values. Normally, I just right-click an element and use the contextual menu to go to “inspect element” but this method will never get you the :hover values.
I’ve run into web inspector/DOM reporting over-zealousness from a different, likely sacrilegious direction. My company’s CSS is shared across different teams and skill-sets. We aim for liberal commenting (later stripped out by hand or caught by our compressor, of course), however we’ve also started to include comments via invalid CSS properties, too, so they show up in Firebug, etc. Example: ‘cleanup-note: “background img should move to sprite”;’.
The challenge is that we’d like those comments to show up in web inspectors where a designer is *investigating* an issue rather than having to go into the code (and our CMS + source control monolith) itself.
Of course, the browsers + web inspectors strip out invalid properties. The work-around we’ve used so far is something like ‘content: “NOTES: …blah…”;’ without a pseudo-class of :before or :after. Gross but it works.
I’m glad that web inspectors have become so ingrained in web workflow that we’re nitpicking advanced details. Is our web-inspection sophistication is pushing past the rendered DOM? Would the ability to provide custom/different validation schemas to web inspectors help? If so, how does the community take on a bigger, standardizing(?) role in web inspector features?
Pingback ::
Max Design - standards based web design, development and training » Some links for light reading (3/11/09)
[…] Pseudo-Phantoms […]
While I definitely see your point and agree that it’s annoying for debugging purposes, I don’t think the tools are in the wrong. You’re inspecting the P element and you see its styles and rules. You’re not expecting the (pseudo and thus not in the DOM) :after element, so you don’t see its rules.
Really, IMHO, they should adapt the DOM engines and debuggers to artificially put the :after elements into the DOM, at least for debugging purposes.
Thanks for pointing that out John. I also primarily use “Inspect Element” and had just about forgotten about the CSS tab in the Firebug toolbar. I’m surprised this doesen’t get mentioned more around the web.
Once upon a time in Mozilla, before Firebug (and maybe even Firefox), the venerable DOM Inspector had a nice feature for this. A contextual menu allowed one to explicitly set the pseudo state applied to the focused element. I’ve sorely missed this feature in Firebug.
This issue has already been reported within the Firebug project at Google Code: Issue 365: Show :after and :before properties in CSS tab
Personally, I find it confusing that the Developer Tools in IE8 shows the styles associated with a DOM node for any medium, even if the medium is not active, such as print styles. Also, the Developer Tools would be much more useful if it could show dynamically-generated DOM nodes. Still, it’s a great resource and many people (myself included) benefit from it being included in the browser by default as opposed to being an add-on.
The IE Developer Toolbar for IE6 and IE7 is useful, too, and it will show you the styles for supported pseudo-elements and pseudo-classes such as “
a:link” if you select the element in the DOM tree and then go to the View menu, choose “Source” then “DOM (Element + Styles).”these “bugs” are known at least in firebug .. i guess its just pretty hard to make it work.
if you want to see the :hover pseudo classes for links in firebug, you need to use the inspect tool, hovering over the link and click it.. firebug now shows you the :hover pseudo class.
apart from pseudo classes and elements, each @* expression, like @font-face, @media etc. are also not shown by firebug (don’t know about the other inspectors tho)
@Tiff Fehr: That last hack may fail in a majorly bad way relatively soon, when browsers start supporting content-replacement via the content: property on normal elements. If I were you I’d stop doing that *right now*, lest you forget and suddenly people start complaining about odd debugging messages showing up on your pages.
I must be missing something, but I’m failing to see where Firebug shows inherited style information for the :first-child pseudo-class. Gecko renders it properly, but Firebug never seems to report it.
Also of note: I thought I had a simple, ad hoc method of debugging the :first-line pseudo-class, but it failed also.
HTML:
<p><span>Lorem</span> ipsum dolor sit amet, consectetur adipisicing elit, sed do eiusmod</p>CSS:
p:first-line { font-variant: small-caps; }Both Gecko (Firefox) and Webkit (Safari) render the text in the span properly as small caps, but both Firebug and Webkit’s inspector report the span’s font-variant property as “normal” (inherited). While the :first-line pseudo-class isn’t represented in the DOM, the span is, and its style is not being reported properly.
Dean, I see Firebug showing styles inherited from
:first-childstyles. If you go to the test page I linked in the post and inspect the (newly added) italicized text in the first list item, you should see theli:first-childstyles listed as being inherited.For the record (in response to Olli), DOM Inspector still allows you to set the
hover,active, andfocuspseudo-classes, but no help on pseudo-elements. The appropriate DOM Inspector bug for pseudo-elements is bug 185431. Dylan Helling has written a simple patch to extend Gecko’s inspector interface (used by Firebug, as well) to allow querying individual pseudo-elements. That’s bug 557726.Pingback ::
Learning To Use The :before And :after Pseudo-Elements In CSS - Smashing Magazine
[…] thing to keep in mind is that developer tools such as Firebug do not show the content generated by pseudo-elements. So, if overused, pseudo-elements could cause maintainability headaches and make debugging a much […]
If for whatever reason you want to remove internet explorer developers tool menu here is a video i made
http://vid4.us/free_video_tutorial/157/internet-explorer-how-to-disable-developer-tools-menu/
Actually since the very first version of web inspector webkit/safari has ALWAYS shown the pseudo classes. Just click the little plus icon (different in older versions) at the top of the list of styles. It does the correct thing and lets you toggle on all the various states (:hover, :focus, :active, pseudo elements.
In Safari 5.2 new code based web inspect they are listed below as should be.
Pingback ::
How can I inspect and tweak :before and :after pseudoclasses in-browser? | Stackforum.com
[…] this blog post (dated 2009!) mentions this capability exists in the IE dev tools, but I’m currently using […]