Posts in the Projects Category

The Really Perfect Ringtone

Published 15 years, 11 months past

When I saw a couple of people link to “the perfect iPhone ringtone” last week, I had that sinking feeling that comes from being beaten to the punch.  I knew I should have stayed up an extra hour that one night and just gotten it done!

But wait, hold it, never mind, cancel the panic parade: it was not, in fact, the perfect ringtone.  Crisis averted!  Still, the sinking feeling lingered, reminding me of what could have been, so last night I sat down and got it done.  Now I bring to you the absolutely most perfect ringtone ever.

Feel free to preview it using that link, if you really feel that’s necessary, but frankly you should just charge ahead and download the .m4r AAC for instant ringtoniness.  If for some reason you’d rather have the audio source and do your own ringtone conversions, you can get the same file as a .m4a AAC or a comfy old .mp3.  And for all you completists, there’s a .zip archive of all three formats.

Go.  Ring.  Enjoy.


Expressive Sculptor

Published 16 years, 1 month past

For those of you using Microsoft Expression Web, a free pre-release trial version of CSS Sculptor for Expression Web was announced by the WebAssist folks on Wednesday at MIX08.  So now you don’t have to put up with those snooty Dreamweaver users throwing you the mëtäl hörns every chance they get—throw ’em right back!  Røck!

If you’re curious about CSS Sculptor, I posted in some detail about it when it was first released in August 2007, and there’s of course plenty of enthusiastic copy about it on the WebAssist site.

One thing that’s different about the Expression version as compared to the Dreamweaver version is that it doesn’t have an “Apply” button to apply the input CSS ito the preview window.  Instead, changes are instantly reflected in the little preview.  It’ll be interesting to see how users react to that, since it could mean that the previewed design shatters as the CSS is updated, and then snaps back together upon further changes.  Is that good or bad tool usability?  Hard to say; it could scare people into undoing the shatter-change and never pushing forward, but it could also help users more quickly gain a deeper understanding of CSS by seeing how things come apart and then go back together.  I guess we’ll find out!


Out of Order

Published 16 years, 5 months past

Apologies to anyone who tried visiting meyerweb in the very near past and found it broken.  I’d noticed that suddenly all kinds of comment spam were getting past Akismet and landing in the moderation queue, and was just preparing to ask the spam-fighters about it when I discovered that the blog portions of the site were throwing a PHP error about not being able to find a function I’d written into a plugin.

At which point I discovered that all my WordPress plugins had been deactivated.  I know I didn’t do that, so how they all got turned off remains a bit of a mystery to me.  I’ve turned all the ones I need back on, and things appear to be back to normal.

So Akismet wasn’t being evaded by the spam: it was simply switched off.  Good thing my non-plugin defenses caught everything that poured in during the outage.  Which, come to think of it, must all have been direct-submit spam, since there wouldn’t have been a comment form available on the entire site.  So what they were really avoiding was my direct-submission defensive plugin, not Akismet.

Well, either way, other defensive measures protected the site, so all’s well there.  I’m certainly not thrilled about the site having been largely offlined for a short period, and again, my apologies to anyone who got blocked from information they wanted.

This episode has actually given me cause to reconsider my usual preference to put site navigation at the end of the document source.  When the PHP failed, the navigation was never served up.  Had I put it at the top of the page, it would’ve been present even though the blog posts were failing.  Getting to the static areas of the site would have been possible.  Due to my structural choices, a script failure dramatically affected the usability of the site as a whole.

Something worth thinking about as I slowly work on improving the organization of meyerweb.


Survey Analysis Service

Published 16 years, 6 months past

During our analysis of the responses to the Web Design Survey, one of the things I thought seriously about doing was dumping the whole dataset into a database and building a web front end to query it.  Then I remembered that as back-end developer, I’m an excellent book author.  I know some MySQL and PHP, but I’m right in that sour spot of knowing enough to make the development process slow and error-prone due to my moderate but incomplete knowledge of the languages while not knowing enough to correctly design the project from the outset.  So I stuck to Excel and the like, which can be cumbersome but quickly learned.

I was a little sad, though.  I’d had the thought that if I built an interface to the survey results, it could be released publicly once we were done.  With such a tool, anyone could generate their own pivot tables without having to learn the process in Excel (or deal with Excel’s handling of enormous data files).  That seemed like a really good thing.

Well, the dataset is public now.  So how about one or more of you super-sharp developer types, the ones who didn’t check any of the boxes on the question about gaps in your back-end coding skills, doing what I could not?

The basic scope of the project would be to list the various data points (gender, ethnicity, age bracket, salary, geographic location, perception of bias, etc., etc., etc.) and let a user pick the two they want to analyze against.  So if someone wanted a table showing the breakdown of gender by ethnicity, they would pick one to go on the top and the other to go on the left.  The table generated would give those numbers.  I’d have it spit out raw numbers, but allowing the user to optionally get the results as percentages might be a nice touch.  Though then you’d have to let the user say which way the percentages are calculated: by column, or by row.

For extra deepness, one could also filter the results based on the value for a third data point.  With that sort of feature, one could get the breakdown of gender by ethnicity for only the EU respondents.  I might do it by letting the user click on a data point and then pick the specific filtering value via a dropdown.  Maybe three radio buttons: one for top, one for left, and one for filter.  Or, heck, do a whole Web 2.0 drag-n-drop interface.  That part’s not important.  What matters is giving anyone the ability to easily get numbers out of the massive dataset.

The only real challenge I can foresee is where questions allowed more than one answer, like the location of work question and the skill questions.  In the dataset, they’re just comma-separated value lists.  Those would need to somehow be broken out into subtables or Boolean columns or something.  The actual structure of the solution interests me a whole lot less than simply having one.

I’m quite sure this is the kind of thing a real programmer could create in about a day.  As I am not a real programmer any more, it would take me a month or four.  Let’s not wait.  Anyone out there able to take the idea and run with it?


Digging Into the Data

Published 16 years, 6 months past

One of the practical reasons we released the anonymized data sets from the 2007 Web Design Survey was that we knew we couldn’t ask every possible question, let alone report on the results.  For that matter, we knew we wouldn’t even be able to come up with every possible question.  It’s one thing to approach this enormous mountain of data with a specific question in mind; those questions always seem obvious to the questioner.  In that case, there’s a clear path to the summit.  But we didn’t come at this with a specific angle in mind.  We just wanted to know what the profession looks like.  So we not only didn’t have a clear path to the summit, we didn’t even have a summit to reach.  Instead, we had thousands.  The tyranny of choice came down on our heads like a, well, like a falling mountain.

So the obvious choice was to release the data for others to analyze in search of their own summits, and I’m really glad to see people already doing so.  One gentleman is looking to produce an analysis of UK respondents, for example.  Others are asking specific questions and getting surprising results.

For example, Rebekah Ahrens grabbed a copy of the dataset and pulled out the answer to a straightforward question: what’s the gender distribution for the various age groups?  What she found was that almost without exception, the younger the age group, the smaller the percentage of women.  Here’s a chart showing the results she found in graphic form.

Wow.  What is causing that?  It’s a pronounced enough pattern that I initially wondered if it was somehow an artifact of the analysis method.  Several times during the authoring of the report I’d think I’d found some amazing and previously unsuspected trend… only to discover I’d divided some numbers by the wrong total, or charted column-wise when the table was row-oriented.  Mistakes along those lines.  They happen.  But I really don’t think that’s the case here.

Now, the really important question is why this pattern exists, and that’s where the data fail us—we can’t get the numbers to reveal all the forces that went into their collection.  There are any number of reasons why this pattern might exist.  I thought of three hypotheses in quick succession, and I’m sure there are many more of equal or greater plausibility.

  1. Younger women didn’t hear about the survey, and so didn’t take it.
  2. Women are losing interest in the field, instead heading into other career paths, and so those who have stuck with the field longer are more prevalent.
  3. Increasing margins of error at the low and high ends of the age spectrum reduces the confidence of the numbers to the point that we can’t draw any conclusions.

Remember, these are all hypotheses, any one of which could be true or not.  So how would we go about proving or disproving them?

  1. Conduct a survey of women in the field to see if they answered the survey, if they know others who did, the ages of themselves and those others, and so on.  Difficult to undertake, but not impossible.
  2. Ditto #1, although a possibly useful followup analysis would be to look at the gender distributions by longevity in the field and then cross-reference the two results.
  3. Get someone who is a statistician to figure out the likely margins of error to see if that might explain things.  I’d do it, but I have no idea how.  I would tend to be skeptical of this as an explanation given the clear trend, but I suppose it is possible.

I can, however, create the gender-by-longevity chart mentioned in #2 there.

Check it out: above six years’ longevity, women are consistently more represented (compared to the overall average) than they are below six years’ longevity.  The only exception is a spike at “1 year or less”.  Is that enough to explain the trend Rebekah spotted?  It doesn’t look like it to me, but then I’m not a statistician.  I also wonder a bit about the spikes at edges of the longevity spectrum.

I’m not trying to propose an explanation here, because I don’t have one.  I don’t even have an unsubstantiated belief as to what’s happening here.  I know just enough to know that I don’t know enough to know the answer.  What I’m saying is this: the great thing is that anyone can do this sort of analysis; and that even better, having done so, we can start to figure out what questions we need to be asking of ourselves and each other.


Analytical Breakdowns

Published 16 years, 6 months past

As a member of the incredible team that’s worked so hard to create it, I couldn’t be more pleased to announce the publication of the findings of the 2007 Web Design Survey.

It’s amazing how many things this process broke.  Right from the outset, the enormity of the entire enterprise pushed all sorts of things past their limits.

The first thing the survey broke was our expectations.  I can only speak authoritatively for myself, but I think the general sense in the team was that we’d be really happy if the number of responses approached 10,000; I myself was expecting somewhere in the 7,000 – 8,000 range.  Instead, we got 32,831 responses.  So many people took the survey at once that it slowed down the Event Apart server, where the survey was hosted.

Although the survey software collected all that information with nary a hitch, getting it back out was another question.  Over the first few days, I was grabbing snapshots of the results as they came in.  That had to stop when an export request brought the entire server to a grinding halt.  Turns out we’d hit a limitation in the software’s code that made exports of tables above a certain size run very, very slowly.

When everything was finished and it was time to run the final export, the same problem bit us again: only this time, we couldn’t get the data out at all.  It was finally Mark Huot who extracted it by hacking the software a bit and running a custom-configured local server instance just to get it extracted in CSV format.

Which left us with a 35.8MB CSV file that needed to be cleaned a bit, as it had some funky characters in it that prevented a straight import into Excel (or anything else).  Have you ever tried to load a 35.8MB text file into a text editor?  It takes a while.  At one point, I honestly feared I’d locked up BBEdit.  And that was just to load it.  Imagine doing find-and-replace operations.  With grep.  (Now imagine constructing the grep expressions needed without gacking half the file.)

But eventually we got the file scrubbed clean and imported into Excel.  The end result was a 21.7MB Excel file.  Have you ever tried to work with a 21.7MB file in Excel?  It takes a while.  Hell, just hitting “Save” sometimes meant a three-minute wait.  And then there’s doing data analysis on a file that large.  Have you ever…?  Right, you get the idea.

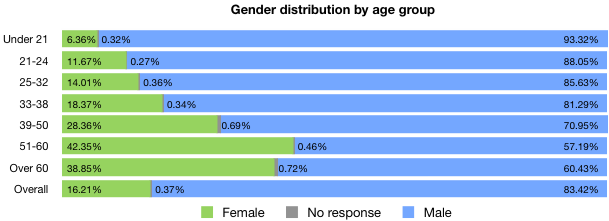
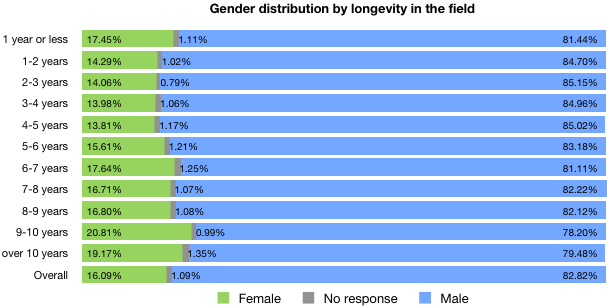
The next thing that broke was our ability to process the data in meaningful ways.  I was able to pull some high-level numbers—what you might call surface analyses—for each of the questions.  For example, I could tell you the breakdown of titles, or genders, or education levels; in effect, all the charts in the final report’s introduction (that is, Figures i – xxviii).  At one point, I could even tell you what proportion of the respondents had 401(k)s.  But when it came to looking more in-depth, I was out of my depth.  Want to know the educational-level distribution of female part-time workers at non-profits?  I was lost.  A statistician I’m not.

So we hired two.  Jeffrey and I decided to use some of the proceeds from An Event Apart to retain two professional statistical consultants, Alan Brickman and Larry Yu, and we worked with them to identify interesting questions and patterns.  They did a superb job of not only breaking down the data for us, but also keeping our pattern-recognition impulses in check.  It’s tempting to look at a spike in numbers and invent reasons for its existence, and they reined us in more than once.

For example, and here’s a tiny peek into the results, we found that the higher a respondent’s salary, the more likely they are to participate in formal training (Fig. 9.6, p. 73, in case you want to go straight there).  But why?  Do they make more because they undergo more training; or undergo more training because they can afford it, or can afford to make their company pay for it?  Do not know, so cannot say.

Of course, it’s one thing to get a few hundred tables of numbers and a lengthy written summary from your consultants.  It’s quite another to turn it into a report that distills it all down to the essence, and looks good to boot.  And that’s where we started to heave real trouble.

I mean, sure, Excel can spit out charts like nobody’s business, but I have news: visually speaking, they really aren’t very good charts.  I know you’re shocked to hear this.  Perhaps under most circumstances that would be okay, but the charts that would go into our final report needed to look professional.  And by that, I mean designery professional.

As Head Chart Guy, I grappled with Excel (the Office X version) for weeks.  I learned more about Excel charting than I’d ever known, and still I could not get it to do what I wanted.  Right aligning the left labels on a chart?  The only way was to set the text rotation to something other than zero.  Then they’d all right-align, but also not be straight horizontal labels.  Plus they looked like crap that way, because there was no anti-aliasing happening on the text, or really anywhere else.  And so on.  We absolutely needed Excel to analyze the data, but its graphical output wasn’t what we needed.

So we looked around.  We considered PlotKit; we thought about pure CSS graphs; we even considered hand-drawing every last chart in Illustrator.  Eventually, we decided to give Numbers a try.  And immediately broke it.

Remember the big ol’ data files I mentioned earlier?  It turns out that Numbers was unable to even open them.  We couldn’t do any of our analysis in Numbers.  In hindsight, this was probably a good thing, because I don’t think it does anything like pivot tables, and those were absolutely fundamental to the whole process.  One personal benefit of this whole process for me is that I finally learned how to create pivot tables in Excel.  Strangely, it’s both easier and harder than you might expect.

So in the end, I produced needed data tables in Excel, copied them over to Numbers, and produced the charts there.  In the process, I learned way more about Numbers than I ever really wanted to know.  Jason and I could probably write a medium-sized book on all the things we learned, and learned to hate, about Numbers.  (Like, legends aren’t directly attached to their charts.  WTF?)

Which is not to say Numbers was a total disaster:  far from it.  All the charts you see in the report were created using Numbers, exported to PDF, and dropped into InDesign.  There were a lot of things about Numbers that made the process a lot easier than it would have been, and that very definitely helped us stay organized.  Of course, that just highlighted its limitations all the more harshly.  (You can’t change the separation distance between labels and the chart area?  WTF?)

And then there was the actual assembly, authoring, and proofreading.  Finding typos that inverted claims, mismatches between numbers, charts that were incomprehensible, summary tables that were calculated along the wrong axis.  All the innumerable errors that creep into a process, intensified and magnified by the unusually high information density of this particular project.  Late-stage changes of approach, starting over in places, realizing that things were not as we thought they were.  It’s the kind of thing that might lead one to break a web service.

And now it’s done.  It’s out.  We can rest.

It’s possible that you will not choose to rest, however.  I’m very proud to say that we’re giving the data back to the community that gave it to us in the first place.  Along with the report, we’re also providing anonymized copies of the complete survey data.  Every single one of those 32,831 responses, available in three formats, with only the identifying information stripped away.  If you want to fact-check our results, you can.  If you want to dig deeper, go for it.  If you want to investigate an area we passed over, please do.  It’s all there.  It’s all yours.  It always was yours—we just collected it and held onto it for a little while, and for that trust and honor, we thank you.

So: go read it and let us know what you think.  Tell us how we could do things better next year.  Show us what we missed by producing your own analyses.  And be ready for spring 2008, when we start the cycle anew.


Another Soul Lost to SketchUp

Published 16 years, 7 months past

Hitting a link shared by Unstoppabot, who really needs to get around to fixing his feed linking policy (“View this site”?  Lame!), I was seized with another spasm of appreciation for the deliciousness that is SketchUp.

I did a moderate amount of 3D modeling back in the day.  The specific day in question would be the one where we all thought that images of rendered 3D models and, whenever possible, blobs of text were the absolute last word in Great Web Design.  Remember that?  Wasn’t it fantastic?  When every page title could be a bunch of extruded and beveled sans-serif letters viewed slightly from above, with the whole mess of text angled away from the observer?

Good times.

So anyway, while I was cranking out renderings of page title text and university logos, I also spent some time creating scenes of other stuff.  You can find some of the results if you dig deeply enough here on meyerweb, but that’s not my point.  What I’m trying to say is that I enjoy a bit o’ three dee more than most, and have some knowledge of how difficult it can be to construct models.

When I first heard about SketchUp, I was intrigued but didn’t really buy into all the hype.  It couldn’t be that easy, could it?  And then I watched someone using it—at An Event Apart, as it happens; and no, it wasn’t one of the attendees—and was captivated.  I downloaded the installer while I was sitting there, watching him create and modify shapes as easily as sketching them on paper.  And then I left it uninstalled, because I was afraid of what it would do to my free time.

A few days ago, I finally broke down.  I actually did have a legitimate reason to install and use it, a really good one, but of course I’d been waiting for any reasonable pretense to launch the .dmg and make with the modeling.  So I did.

Color me deeply impressed.  While you’re at it, add some heavy tints of addicted.  I started by modeling our kitchen, and now I want to do the whole frickin’ house.  I’m starting to eye local landmarks for recreation and contribution to the Warehouse and Google Earth.

I don’t have time for this.  I need help.  Stop me before I model again!


CSS Sculptor Released

Published 16 years, 8 months past

I alluded yesterday to “backstage work”.  One of the things going on back there was my work with the folks at WebAssist to create a tool that allows both novice and experienced web developers to create and alter CSS-driven layouts.

The end result is Eric Meyer’s CSS Sculptor (v1.0.0), a Dreamweaver extension that gives the user tons of options and outputs pretty darned clean markup and CSS.  (Even if you’ve no interest at all in Dreamweaver tools, you should still follow that link.  How many chances are you going to have to see me throw the mëtäl hörns?)

Well you might wonder how much code I contributed to this software.  Well, okay, none.  What I did contribute was guidance on the interface and its organization; on what options to present, and how; on ways to handle things like print styles and the print CSS options; and on the CSS and markup that results, including the optional explanatory comments in the CSS.

One of the primary goals with this project was to create a tool that would expose as much CSS as possible to users without overwhelming them, and that would actually teach by dint of showing all the options.  One of the things we heard a lot in the beta test was users saying things like, “Oh, so that’s what that CSS thingy does! I’d always wondered.”  Which was exactly what we’d hoped to hear, along with “Hey, I’ve never heard of this CSS property before!”.  (We heard that one too.)

There are some things I expect will be improved in future releases, like shorthand value minimization—the simplest example of that being a condensation of 0 0 0 0 down to just plain 0.  We discussed including that feature but decided to postpone it for a variety of reasons, not least of which was working out the logic required to figure out when to minimize, which isn’t as simple a problem as you might first think.  There were a few other things we didn’t get in the initial release; such is the way of software.  We’ve got a list of potential features, of course, and are looking forward to hearing what users suggest.

As for what features did make it in, there’s a fairly large list, so it’s probably best to check out the Features page or take the product tour—with video commentary starring, you guessed it, yours truly.  So if you’ve ever wanted to see me greenscreened over screenshots and being intermittently goofy, then at long last your prayers have been answered!  (Or will be, once we get the load problems resolved.)

What makes this whole thing an especially interesting experience for me is that, for the first time in my life, I’m participating in an affiliate program.  Basically, what I earn from sales of CSS Sculptor depends on affiliate fees earned by referral links like this one here (and also earlier in the post).  That might sound like a rip-off, but it has the potential to be quite the opposite.  The affiliate cut is literally an order of magnitude greater than any reasonable per-unit royalty would be.

This compensation scheme (as they say in the UK) is actually an experiment on both sides: WebAssist has never really worked with an outside individual on a product like this, and so they honestly don’t know if the affiliate approach will pay better than a per-unit royalty, or worse.  So we’re going to try it out and see what happens.  Fortunately, I’m in a position that I feel I can afford to experiment like this, allowing both myself and WebAssist to find out what works best in the long run.

Thus, if you’re planning to buy CSS Sculptor or know someone who is, I’d be grateful if you either clicked through one of the links hereabouts or linked to the product using my affiliate URL.  I’ll have a link in the sidebar in the near future as well.  The sidebar’s due for an overhaul anyhow.

So that’s one of the things that’s claimed my time over the last few months, and I’m pretty excited that it’s seeing the light of release.  I’m even more excited about finding out what people think could be better about it so that we can improve what’s already a pretty darned nifty tool.  If I do say so myself.


Browse the Archive

Earlier Entries

Later Entries